Executive Summary
The second quarter was strong, helped by the Iran ceasefire, lower energy prices, and a record rally in semiconductor stocks as companies raised their AI capital spending budgets. In the third quarter, those tailwinds turned into headwinds. The ceasefire collapsed, and the conflict in the Middle East widened, sending oil prices up 36.8% for the quarter. Renewed energy inflation led the Federal Reserve to raise interest rates, and the 10-year Treasury yield rose above 5% for the first time since 2007. While the S&P 500 performed well because of a handful of mega-cap stocks, most stocks fell in the quarter.
Even before the war with Iran and the oil shock that followed, we were concerned that the U.S. economic expansion was narrow and fragile. It rests on three unsustainable pillars: near-record budget deficits, a historic AI capital spending boom, and consumer spending increasingly concentrated among the wealthiest Americans, who have benefited most from Fed-inflated asset prices. Third-quarter events deepened those concerns. The Fed's September rate hike was its first since 2023, and policymakers signaled more are likely. Higher rates and tighter monetary conditions weaken all three pillars. They widen the deficit by raising the government's interest costs. They make it more expensive for AI companies to finance their capital spending. Higher risk premiums also depress asset prices, weakening the wealth effect that supports spending by affluent households.
We believe the AI investment boom is unsustainable and that the technology sector is in a bubble. History's great investment manias followed a similar path, from the railway mania of the 1840s to the radio and electrification boom of the 1920s and the telecom buildout of the 1990s. In each case, a transformational technology arrived when credit was plentiful. Investors overestimated demand, overbuilt capacity, and suffered heavy losses, while the technology survived, and consumers benefited. Hyman Minsky's framework explains how these cycles end. Financing shifts from "hedge finance," in which cash flow covers debt obligations, to "Ponzi finance," which depends on rising asset prices and new capital just to meet existing obligations. We believe parts of the AI boom have reached the Ponzi stage.
The S&P 500 is no longer diversified in any meaningful sense. Mega-cap stocks and the AI trade dominate the index. It has benefited enormously from the AI boom, which leaves it highly vulnerable when the boom ends. Today, the S&P 500 shows the kind of concentration and speculation that has marked past market peaks.
We remain underweight equities because their long-term risk-reward is unattractive, and the narrow breadth of the recent rally reinforces our caution. In a regime of modest growth and rising inflation, we favor assets that have historically held up well when inflation is high: value stocks, international equities, gold and short-duration fixed income. We will stay focused on preserving capital through a diversified, balanced portfolio until equities offer a more favorable risk-reward.
Third Quarter 2026 Market Review:
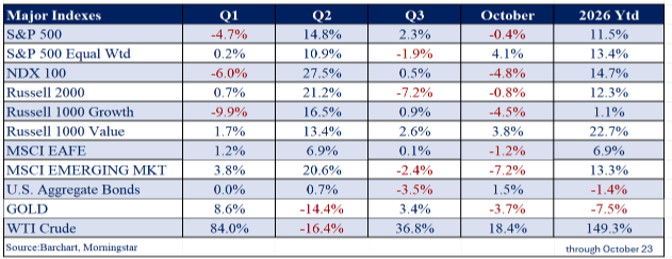
After a strong second quarter defined by the Iran ceasefire, lower energy prices, and a record surge in semiconductor stocks due to accelerating AI capital expenditure budgets, stocks were mixed in the third quarter because of significant headwinds. The conflict in the Middle East broadened, driving oil prices up 36.8% in the quarter. Elevated inflation and the renewed energy shock led the Fed to raise interest rates, pushing the U.S. 10-year Treasury yield above 5%, its highest since 2002. While the S&P 500 performed well because of a handful of mega-cap stocks, most stocks fell in the quarter.
In this risk-off environment, the S&P 500 rose 2.3% for the quarter, while the equal-weighted S&P 500 and the Russell 2000 small-cap indexes fell 1.9% and 7.2%, respectively. International stocks were flat for the quarter. The MSCI EAFE rose 0.1%, while the MSCI Emerging Markets fell 2.4%. While most stocks declined in the third quarter, the S&P 500 rose modestly, driven by the heavy concentration in AI stocks, which now make up nearly half the index. Within the AI trade, however, leadership shifted from the volatile chipmakers back to the mega-cap Magnificent Seven.
Interest rates rose sharply in the third quarter as the conflict in the Middle East escalated and energy prices pushed inflation higher. In September, the Federal Reserve raised its short-term interest rates by 0.25%, to a range of 3.75%–4.00%. It was the Fed's first increase since July 2023. Markets now expect a brief tightening cycle: one more 0.25% increase at the December meeting and two more hikes in the first half of next year. The U.S. 2-year Treasury yield jumped 71 basis points to 4.90%, while the 10-year yield rose 82 basis points to 5.29% — its highest close since 2002. Additionally, the 10-year TIPS yield closed September at 2.93%, its highest level since November 2008, and the yield curve steepened modestly to 0.39%, still well below its 50-year median of 0.80%.
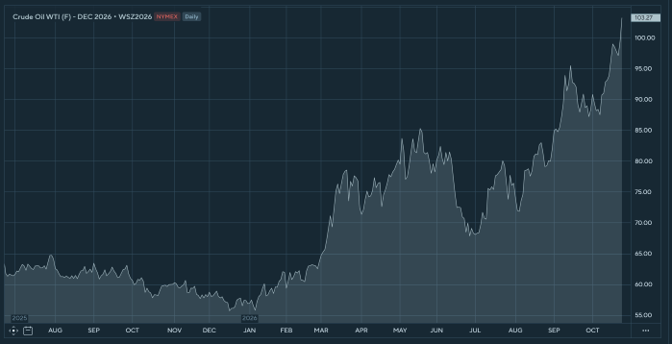
Oil rose 36.8% in the third quarter and has gained another 18.4% so far in October as the Middle East conflict has worsened and spread. The region is now in a dangerous stalemate. Crude exports have largely recovered, but shipping costs are much higher, and U.S. naval escorts cannot go on indefinitely. The more acute problem is refined fuel. Distillates (diesel and heating oil) remain in severe short supply, with U.S. inventories below their five-year average heading into winter. Oil prices climbed further last week on reports that the U.S. may resume strikes against Iran after the November midterm elections. If strikes resume, Iran has warned it will target energy infrastructure across the Gulf, which would deepen the energy crisis.
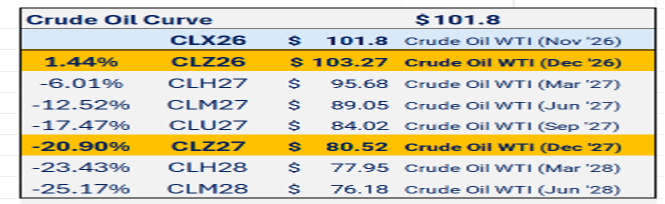
After peaking around $85 in May, as the ceasefire with Iran was negotiated, oil prices have surged, and the December WTI crude oil futures now trade at their highest level since the war started. The WTI Crude Oil Futures curve indicates that investors expect energy prices to remain elevated for most of next year.
Source: Demark Analytics and Barchart.com
After a 29.7% peak-to-trough decline in the first half of 2026, gold rebounded a modest 3.4% in the third quarter. Gold reached a record $5,608/oz in late January on geopolitical fears and heavy central bank buying. It then fell sharply as real rates rose, the dollar strengthened, and the Fed shifted from expected cuts to rate hikes. Those headwinds have continued into October. However, gold has held above its June low despite significantly higher interest rates and appears to be building a base.
We believe gold offers an attractive long-term risk/reward at current levels. The structural case for gold remains intact: historically large peacetime deficits, a heavy federal debt burden, and steady central bank buying as foreign governments diversify away from the dollar. With long-term yields at their highest level in more than two decades, we believe rates are near a peak. When real yields decline, the main headwind behind this year's selloff should become a meaningful tailwind.
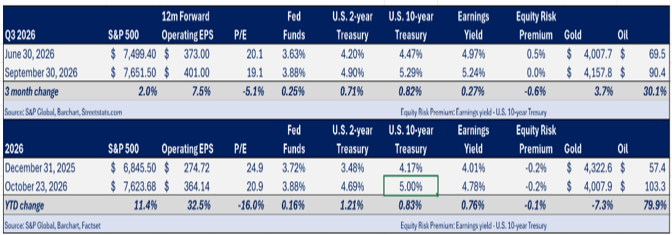
The U.S. economy remained resilient despite rising inflation and higher interest rates. Real GDP grew at an annual rate of 2.2% in the second quarter, driven by consumer spending and heavy AI-related capital investment. The unemployment rate edged up to 4.2% in September. That is still well below its 50-year average of about 6.0%. Job creation, however, has slowed sharply: payrolls grew just 0.3% over the past year, compared with the roughly 1.4% pace associated with a healthy labor market. Headline CPI inflation rose to 3.7% in September, led by a jump in gasoline prices. Inflation has now run above the Fed's 2% target for more than five years, which we consider unacceptable.
Concentration Risk and Weak Market Breadth
Because the future is always inherently uncertain, we believe in maintaining a diversified, balanced portfolio built from investments that offer adequate risk premiums. We have long viewed the S&P 500 as offering a poor long-term risk/reward, given its extreme valuation and heavy concentration in AI-related technology stocks. This year, a narrow group of AI and semiconductor stocks has produced most of the index's gains, a pace we view as unsustainable and that masks weakness in the broader stock market.
The third quarter did nothing to ease our concerns, although a shift in leadership within the AI trade suggests investors may be growing slightly more cautious. After a record 87.8% surge in the second quarter, the Philadelphia Semiconductor Index (SOX) fell 28.6% in five weeks, from its June 22 peak to its July 29 low, and ended the third quarter down 11.4%. As chip stocks retreated, investors turned to the larger, less volatile Magnificent Seven, which rose 11.5% in the quarter, led by Microsoft (+37.5%) and Meta (+28.7%). As a result, the 10 largest companies now make up a record 40.9% of the S&P 500, and semiconductors, a volatile and highly cyclical industry, still account for nearly 18% of the index.
Q3 leadership was even narrower than Q2's. By our estimates, the Magnificent Seven contributed about 3.6 percentage points to the S&P 500's 2.0% price gain, roughly 180% of the index's return, while the other 493 companies subtracted about 1.6 points. Without those seven stocks, the S&P 500 would have declined in the third quarter.
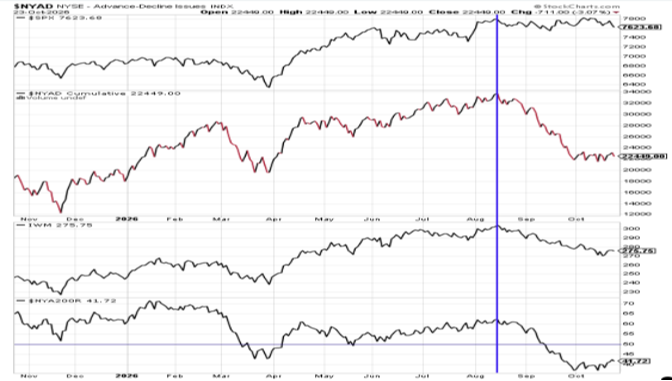
Although the S&P 500 is just 2.8% below its all-time high and has gained 12.3% this year, the broader market has been in correction since August. The median stock in the index is 14.6% below its 52-week high, and 171 (34.2% of the S&P 500) have fallen more than 20%, placing them in bear-market territory, while 93 (18.6% of the S&P 500) have dropped by more than 30%. We believe much of this weakness reflects the sharp rise in interest rates and investors' demand for larger risk premiums. Historically, weak market breadth presages significant market declines.
The S&P 500 has traded in a narrow range for the past four months, held up by a handful of mega-cap AI technology stocks, while the broader market has been weakening since August 14. The Russell 2000 has entered a correction, and the NYSE advance-decline line has fallen steadily, meaning more stocks are declining than advancing. The share of NYSE stocks trading above their 200-day moving average has dropped from a healthy 62% to a weak 40%. Breadth this weak has often come before significant market declines.
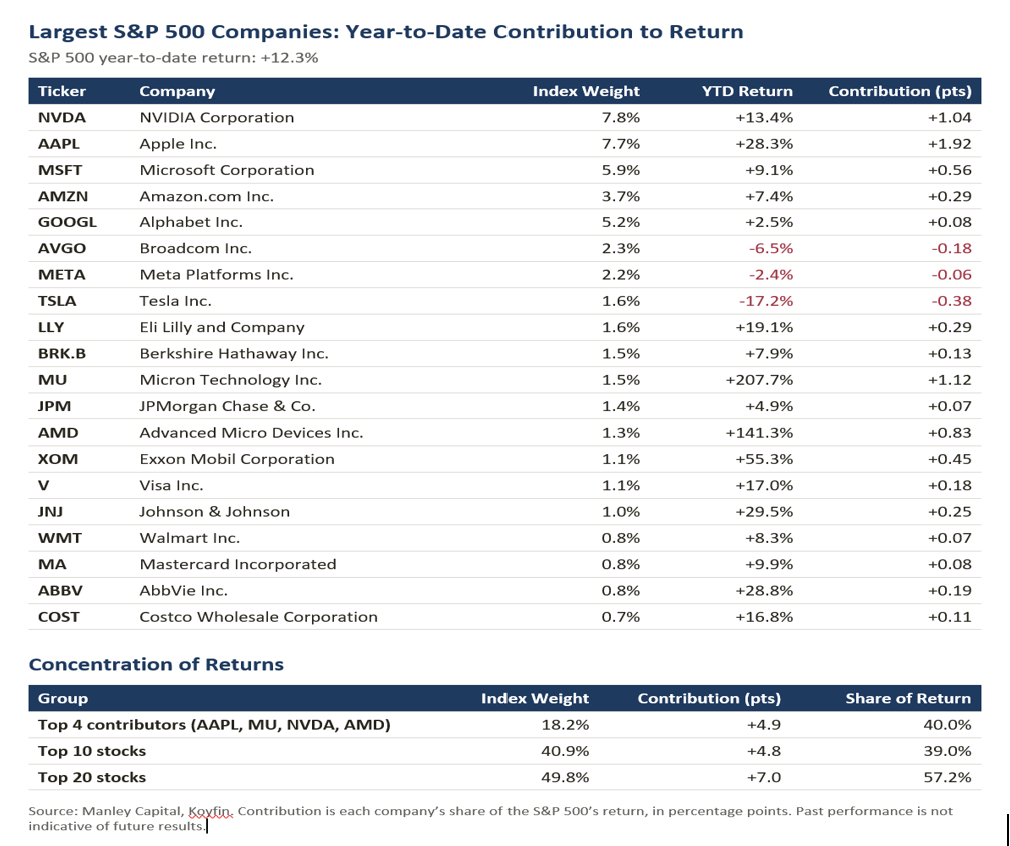
While the S&P 500 is up a robust 12.3% this year, a small group of mega-cap and AI stocks has driven its performance. Just four technology companies, NVIDIA, Apple, Micron, and AMD, make up 18.2% of the index yet account for 4.9 percentage points, or 40%, of its year-to-date return. The 20 largest companies, which make up about 49.8% of the index and have delivered 57% of the gain. Investors should not be complacent when so few stocks drive the market's most important index.
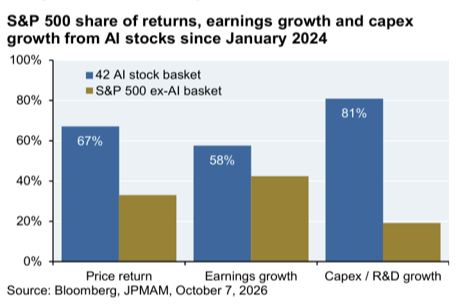
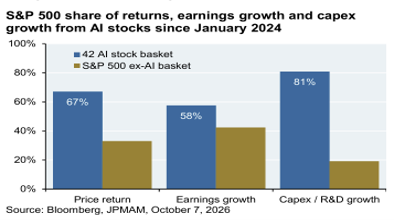
For several years, AI stocks have driven the S&P 500. According to J.P. Morgan's Michael Cembalest, a basket of just 42 AI-related stocks has generated 67% of the S&P 500's price return and 58% of its earnings growth since January 2024, when the AI mania began.
Source: JPMorgan
In Summary
The S&P 500 is near a record high and, by several long-term valuation measures, is among the most expensive in history. Its 2.3% third-quarter gain masked continued deterioration beneath the surface. That kind of gap between index performance and underlying breadth has historically preceded major market tops.
The S&P 500 is no longer diversified in any meaningful sense. Mega-cap stocks and the AI trade dominate it. The index has benefited enormously from the AI boom, leaving it highly vulnerable when the boom inevitably busts. Today, the S&P 500 shows the level of concentration and speculation that has marked past market peaks:
• Record concentration. The top ten companies represent a record 40.9% of the S&P 500, and semiconductors alone are nearly 18% of the index. By way of comparison, index concentration is now higher than it was at the peak of the 2000 dot-com bubble.
• Narrow leadership. The Magnificent Seven accounted for roughly 180% of the S&P 500’s Q3 price gain; the rest of the index lost ground, and the equal-weighted S&P 500 fell 1.9%, while the small-cap Russell 2000 plunged 7.2%. This is not a healthy, broad-based bull market.
• A higher hurdle from bonds. With the 10-year Treasury around 5.00% and long-term real yields near 3%, the S&P 500’s CAPE earnings yield of roughly 2.5% offers little compensation for equity risk, especially amid rising inflation, a war in the Middle East, and a Fed rate-hiking cycle.
In our view, it is prudent to rebalance away from this concentrated technology bet and into parts of the market that offer both diversification and attractive valuations and risk premiums: value equities, mid-caps, and international stocks.

Economic Outlook
As value investors, our asset allocation is driven by long-term valuation measures and the risk-reward opportunities present in the market. Moreover, we analyze leading economic and market indicators to determine the likely paths of economic growth and inflation. This enables us to strategically position our portfolio to perform well in all economic environments.
Before the war with Iran and the oil shock that followed, we were concerned that the U.S. economic expansion was narrow, fragile, and resting on three unsustainable pillars: near-record budget deficits, a historic AI capital spending boom, and consumer spending increasingly concentrated among the wealthiest Americans, who have benefited most from Fed-inflated asset prices. Events in the third quarter deepened those concerns. Inflation, driven largely by energy prices, forced the Federal Reserve to raise interest rates in September for the first time since 2023, and policymakers signaled that more increases are likely. Higher rates and tighter monetary conditions put pressure on all three pillars. They widen the deficit by raising the government's interest costs. They make it more expensive for AI companies to finance their capital spending. Higher risk premiums also depress asset prices, weakening the wealth effect that supports spending by affluent households.
Pillar 1: The Budget Deficit
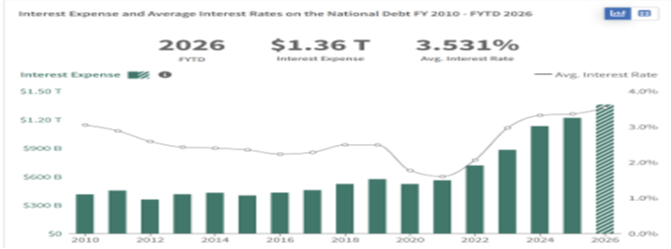
The federal budget deficit remains one of the most important risks facing the U.S. economy. The Treasury Department reported that the deficit reached $1.99 trillion in fiscal year 2026, which ended September 30. That was 12% more than the year before and the third-largest deficit in U.S. history, behind only the pandemic years of 2020 and 2021. Net interest expense on the debt topped $1 trillion for the first time. The federal government is running a deficit of roughly 6% of GDP, a level normally associated with a deep recession, yet the unemployment rate is 4.2%, and the S&P 500 set a record high earlier this month. Large deficits are not a sign of a healthy, self-sustaining economy.
The U.S. Treasury reports that interest expense is $1.36 trillion, which is 4.2% of GDP – the highest level since 1997. The problem worsens because the government's average interest rate is 3.53%, well below today's market rates: short-term rates are near 4% and expected to rise another 0.50% over the next six months, and the 10-year Treasury yield recently reached 5.3%, its highest level since 2002. The U.S. government will need to borrow and refinance existing debt at significantly higher interest rates, leading to a larger budget deficit. Currently, debt held by the public is $32.60 trillion, so a 0.50% increase in its average interest rate would add $163 billion, or 0.5% of GDP.
Despite unemployment near record lows and the stock market at all-time highs, the U.S. is already running an enormous budget deficit and spending nearly 4.2% of GDP servicing its debt. As short-term interest rates rise due to the Fed’s hiking cycle, the deficit will widen further, pushing long-term rates higher and driving debt-service costs even higher —creating a self-reinforcing negative spiral. In our view, this dynamic will continue until the bond market, not the stock market, ultimately imposes the fiscal discipline that Washington has refused to impose on itself.
Source: U.S. Department of the Treasury
Pillar 2: The AI Capital Spending Boom
The second unsustainable growth driver is the AI investment boom. We believe the technology sector is in a bubble, driven by a revolutionary new AI technology that was fueled by the Fed’s easy-money policies. We are concerned about significant malinvestment, and we see signs the bubble is poised to deflate.
Many of history's great bubbles began with a transformational new technology and were fueled by easy money. The pattern recurs: investors recognize a technology that will change the world, and abundant, cheap capital allows them to finance an aggressive buildout of the infrastructure it requires. Euphoria leads to an overestimate of demand and too much investment in capacity. When returns fall short of expectations, financing tightens, and the bubble bursts. Typically, the technology flourishes, and consumers greatly benefit, but the investors who financed the boom suffer heavy losses.
History reveals a recurring pattern: transformative technologies emerge when money is easy, sparking investment booms that outpace real demand. The 1840s railway mania, the 1920s boom in radio and electrification, and the 1990s telecom build-out all followed this path. Each technology was real and eventually transformed the economy. But every boom ended with excess capacity, disappointing returns on capital, and steep losses for investors. The problem was never the technology -- it was malinvestment based on an overestimation of demand.
Economist Hyman Minsky had a theory about how booms turn to bust. He believed that long periods of prosperity encourage lenders and borrowers to take more risks. Financing drifts from "hedge finance”, where cash flows cover both interest and principal, toward "Ponzi finance”, where repayment depends on new capital and rising asset prices.
Today's AI buildout closely fits the classic bubble pattern. Years of near-zero interest rates conditioned investors to pay almost any price for future growth, and the Federal Reserve's imprudent rate cuts in 2024 and 2025 eased financing further just as the AI buildout accelerated. Hyperscalers are expected to commit trillions of dollars a year to data centers, chips, and power infrastructure. Bulls argue that demand for computing power is unlimited while supply is constrained. Yet the companies making these infrastructure commitments increasingly cannot fund them from cash flow and are becoming more dependent on issuing new debt and equity.
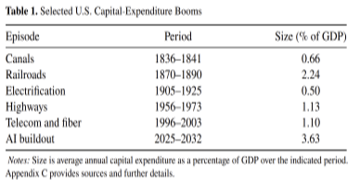
A recent Brookings study projects that U.S. investment in data centers and related AI infrastructure will total about $10.3 trillion from 2025 to 2032, averaging roughly 3.6% of GDP a year. That would make it the largest infrastructure buildout in U.S. history, exceeding the canal, railroad, electrification, highway, and telecommunications and fiber booms.
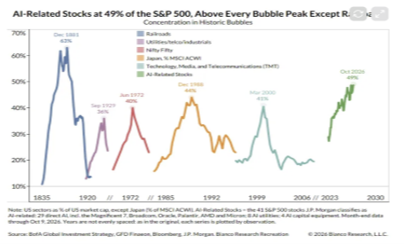
Depending on how it is measured, AI-related investment has accounted for roughly a third to nearly half of U.S. economic growth over the past year. Also, according to JPMorgan and Bianco Research, 41 AI-related stocks in the S&P 500 account for about 49% of its market cap. This is the most extreme level of concentration since the Railroad bubble in the 19th century.
Source: JPMorgan and Bianco Research
Additionally, these 42 stocks also account for 67% of S&P 500 appreciation and 58% of earnings growth since January 2024, when the AI boom started.
Source: JPMorgan and Bianco Research
In our view, both the stock market and the economy have become dangerously dependent on this historic level of capital spending, and we see signs that the bubble is poised to deflate, which could inflict severe economic consequences.
AI optimists argue that demand for compute is effectively unlimited while supply is constrained. Yet the two leading AI labs, OpenAI and Anthropic, are still losing billions of dollars, suggesting they are selling AI services below their cost. If so, today's demand likely overstates what customers would pay once pricing is no longer subsidized—making the true level of demand hard to judge.
The Brookings Institution estimates that the $10.3 trillion invested in U.S. investment in data centers and related AI infrastructure would need about $3.7 trillion in annual revenue by 2032 to earn a 10% return. Today, it is estimated that the leading AI labs, including Anthropic, OpenAI, Google, and xAI, have a combined annualized revenue run rate of roughly $125–150 billion. Growing from $150 billion to $3.7 trillion over six years would require a compounded annual growth rate of about 71%, a roughly 25-fold increase that has few, if any, precedents at this scale.
The growth needed may be even harder to reach because AI revenue growth may already be slowing. At an October 14 briefing for prospective IPO investors, Anthropic reported that its third-quarter revenue rose about 45% sequentially from the second quarter, which is down significantly from the Q2 sequential growth rate of about 147%.
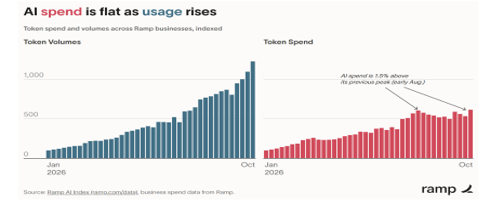
Also, recent data on business AI spending suggests that demand growth may be slowing. Ramp, a digital financial company, tracks corporate card and bill-pay spending at more than 85,000 U.S. businesses, and its October report shows that spending on AI models was essentially flat in August and September. Among the heaviest users, the top 1% of firms, which account for about 80% of spending on OpenAI and Anthropic, monthly spending per employee in September was 3.1% below its July peak. Ramp's lead economist attributes the slowdown to falling prices rather than weaker usage: the number of tokens businesses used kept rising, but competition and more efficient models pushed down the price per token.
Falling prices are normal in technology, but the slowdown in spending is a serious problem for the AI investment case. AI revenue is price times volume, so if prices fall as fast as usage grows, revenue stalls.
Source: Ramp
Two forces are likely behind the slowdown. The first is competition from low-cost Chinese open-source models, which can be 60% to 90% cheaper than the leading U.S. models and now handle most of the developer traffic on major model-routing platforms. Second, companies may be limiting their AI spending until productivity gains show up more clearly in their results.
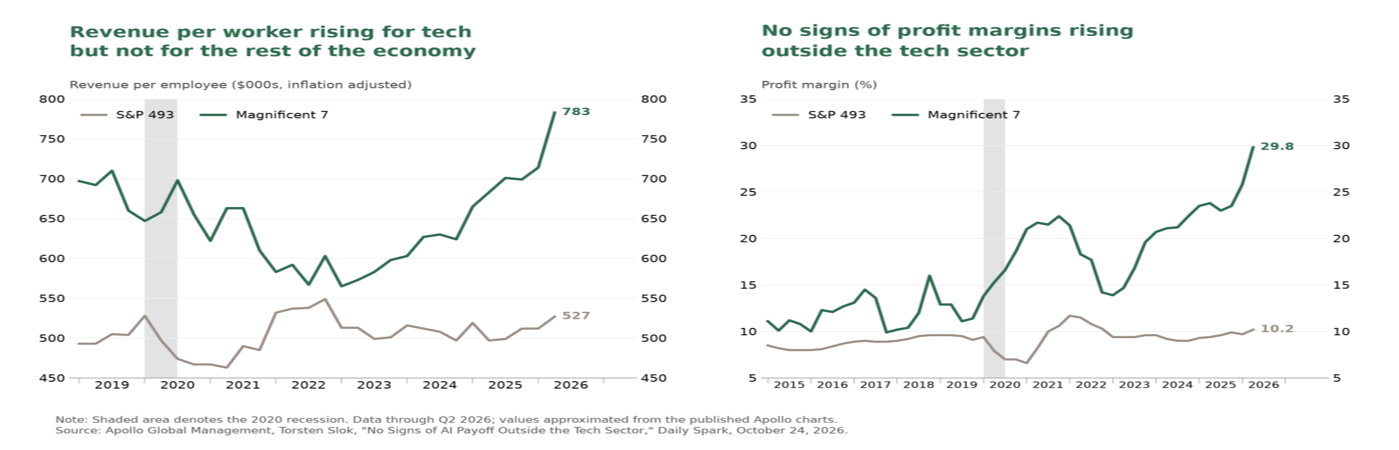
Torsten Slok, chief economist at Apollo Global Management, argues that "despite massive investments and widespread hype around artificial intelligence, the technology has delivered zero financial payoff to corporate America outside of tech." Revenue per worker and profit margins are rising for the Magnificent Seven but have been flat for the rest of the S&P 500, and he sees "no signs of AI boosting productivity growth." As a result, he writes, "mainstream corporate America is pulling back and starting to view token spending not as a source of growth but as a cost center that weighs on margins."
Source: Apollo Global Management
Beyond the revenue needed to earn an adequate return, we are concerned about how concentrated the demand behind the data center buildout is. Microsoft, Alphabet, Amazon and Oracle report a combined backlog of about $2.3 trillion in contracted future revenue, and Wall Street expects the hyperscalers to invest about $3.4 trillion over the next three years. More than half of that backlog, over $1.0 trillion, is owed by just two customers, OpenAI and Anthropic. Both are private companies with limited financial disclosure and unproven business models. Both still report large losses on a standard accounting basis, and both face growing price competition from cheaper and increasingly capable Chinese open-source models.
In other words, the hyperscalers, along with newer providers such as SpaceX, are committing trillions of dollars in increasingly debt-financed capital spending against the promises of two private companies that are deeply cash-flow negative and must raise new capital to meet their massive obligations. That is the hallmark of what Hyman Minsky called “Ponzi finance”: borrowers whose cash flows cannot cover their commitments and who depend on a steady supply of new financing and rising asset values to meet their obligations.
In October, investors, especially credit investors, began to reassess the AI boom and limit the capital available to finance it. Several AI-related IPOs were canceled or postponed. Firmus, an Nvidia-backed data center operator, scrapped a planned listing of nearly $5 billion, Blackstone-backed AirTrunk delayed its listing to 2027, and SK hynix ended plans for an IPO of its Solidigm unit. On October 22, Meta shares fell about 7% after the company signaled it would invest even more aggressively in AI. It raised the low end of its 2026 capex forecast to $135–145 billion and disclosed about $825 billion in future spending commitments, up from nearly $700 billion in July. It also announced a new class of nonvoting Class C shares, which it said would give it "the ability to finance its growth" while ensuring that Mark Zuckerberg "continues to lead Meta into the next era." Credit markets reacted as well: the cost of insuring Meta's debt against default rose to a record high.
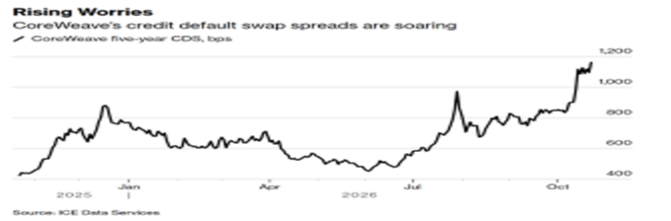
As financing becomes more expensive and harder to obtain, the companies that depend on it the most will find it increasingly difficult to keep spending at the pace the buildout requires. CoreWeave, a $30 billion AI neocloud, illustrates the risk. Its shares fell about 35% in October. Its bonds have sold off to yield roughly 15%, and the cost of insuring its debt now implies about a 50% chance of default within five years. Meanwhile, its three co-founders have sold about $3.3 billion of stock since the company's 2025 IPO. Over the weekend, Elon Musk wrote that "debt markets have almost entirely shut off access to money for any company that doesn't have substantial revenue independent of AI data centers," and predicted that the more than 200 neoclouds face "guppy-level death and consolidation."
Source: Bloomberg
It's encouraging that investors and lenders finally seem more selective and require higher risk premiums before they fund AI infrastructure. But that selectivity does not remove the risk. The AI trade still depends on capital spending that keeps accelerating. Hyperscaler budgets drive revenue for semiconductor, memory, power, and data-center companies. Through those companies, they also drive much of the S&P 500's earnings growth and market leadership. In our view, a slowdown in capex growth would be enough to deflate the AI bubble, and CoreWeave and the other neoclouds may be the canaries in the coal mine.
Finally, Anthropic is expected to go public in the coming weeks. This is a watershed for the AI boom: for the first time, public markets will price a frontier AI lab, and that price will rest on audited financials rather than private-round marks. Until now, investors have judged the AI boom mostly through the companies selling into it, such as chipmakers, hyperscalers and data-center builders. As a public company, Anthropic will report regularly on end demand for AI, giving investors a clearer read on whether the massive AI build-out can earn an adequate return.
The deal's size also tests how much risk capital markets can absorb. Anthropic is reportedly seeking a valuation of more than $1.5 trillion and could raise as much as $100 billion, topping SpaceX's record $86 billion offering. A weak debut would suggest that funding for the AI build-out depends more on investor enthusiasm than fundamentals.
In Summary
We believe the AI investment boom is unsustainable and the technology sector is in a bubble. History's great bubbles, including the 1840s railway mania, the 1920s radio and electrification boom and the 1990s telecom buildout, followed the same path. A transformational technology arrived when money was easy, investors overestimated demand and overbuilt capacity, and the boom ended in heavy investor losses even though the technology survived. Hyman Minsky's framework explains how financing drifts from cash-flow-funded "hedge finance" toward "Ponzi finance," which depends on new capital to meet obligations.
Today's AI buildout fits that pattern. U.S. AI infrastructure investment is projected at $10.3 trillion through 2032, the largest buildout in U.S. history. AI accounts for a third to half of recent economic growth and about half of the S&P 500's market value. To justify the buildout, revenue would need to grow about 71% a year through 2032, yet growth is already slowing. Anthropic's revenue growth has decelerated sequentially, business AI spending has flattened, prices are falling under Chinese competition, and Apollo finds no payoff outside the technology sector.
Demand is also dangerously concentrated. About half of the hyperscalers' $2.3 trillion backlog is owed by OpenAI and Anthropic, two loss-making private companies that depend on new capital, which is the hallmark of Ponzi finance. In October, the capital markets began to tighten. AI-related IPOs were canceled, Meta fell on higher spending and plans to issue new stock, and CoreWeave's stock plunged, and its debt moved into distressed territory. We see signs that the bubble is poised to deflate, with potentially severe economic consequences.
Pillar 3: The Wealth Effect and the “K-Shaped” Economy
The U.S. economy stayed resilient despite rising inflation and higher interest rates. Real GDP grew 2.2% annually in the second quarter, driven by consumer spending and heavy AI-related investment. The unemployment rate edged up to 4.2% in September, still well below its 50-year average of about 6%. However, headline CPI inflation rose to 3.7% in September, led by a jump in gasoline prices. Inflation has now been above the Fed's 2% target for more than five years, which is unacceptable and why the Fed is finally raising interest rates.
Headline growth and unemployment still look solid. But averages hide the extremes. More than five years of high inflation have split the U.S. economy into a clear K shape. The wealthiest 10% of households are doing well. Record stock and home prices have raised their net worth, reduced their need to save, and encouraged them to spend more. Meanwhile, most households have faced higher costs and a steady decline in their standard of living. Many have cut back on savings just to maintain their standard of living.
Prosperity is now extremely concentrated. The top 10% of households account for nearly half of all U.S. consumer spending. They own about 87% of the stock market and 44.5% of homes. The wealthy have benefited from the Fed's profligate monetary policy after COVID. The Fed kept interest rates too low for too long and printed trillions of dollars to stimulate the economy, which fed asset bubbles in stocks and housing. These profligate monetary policies also created persistent inflation, which hurt most Americans' living standards.
The AI capex bubble has amplified this wealth effect. It began when OpenAI launched ChatGPT in November 2022. Since then, the mega-cap technology stocks that dominate the AI trade have pushed the market to extreme valuations. They now make up roughly 49% of the S&P 500. The bottom 50% of households have gained little from these asset bubbles. They own only 1% of the stock market and 13.2% of homes. So, they have received almost none of the benefit from rising asset prices, while carrying the full weight of the inflation those policies caused.
For years, the Fed under Chair Powell favored Wall Street over Main Street. It kept interest rates artificially low and grew its balance sheet by printing trillions of dollars. These policies pushed asset prices higher, which helped the wealthy. They also pushed inflation higher and lowered living standards for most Americans. The Fed’s new Chairman takes a different view from his predecessors. Chairman Warsh understands that the Fed's bloated balance sheet and the rapid growth of the money supply after the pandemic directly fed the surge in inflation. The Fed had dismissed that surge as "transitory," caused by outside shocks. Warsh has said that "inflation is a choice made by the Fed" and that "inflation occurs when the government prints excessive money — meaning the central bank and the government spend beyond their means." He has also argued that the Fed's bloated balance sheet distorts asset prices and market pricing, which favors Wall Street over Main Street.
After cutting rates by a combined 1.75% in 2024 and 2025 under a misguided Chair Powell, the Fed reversed course in September and raised rates by a quarter point, its first hike since 2023. The Fed is expected to raise rates by another 0.50% through the first quarter of next year. Higher rates and tighter financial conditions should slow inflation. However, they already seem to be affecting asset values and lending, as risk premiums rise and investors and lenders demand higher returns. While we agree the Fed must tighten financial conditions to fight inflation and improve living standards, we are concerned that tighter financial conditions could pop the AI bubble, leaving a fragile economy exposed.
In Summary
The U.S. economy is more fragile than the headline numbers suggest. Current growth rests on three pillars that can't last: record deficit spending, the AI capex boom, and the wealth effect from a narrow stock rally led by a few large companies. All three are now showing signs of strain.
We believe Chairman Warsh understands the Fed's role in creating the K-shaped economy, keeping asset bubbles inflated and allowing inflation to persist. Over the long term, we are optimistic that his approach will restore price stability and rebuild a sound economic footing for households at every income level. In the near term, though, repairing the K-shaped economy means removing the monetary conditions that created it. Restoring a healthy economy for the bottom 90% will likely require letting asset bubbles deflate. A Fed that won't tolerate above-target inflation also won't bail out overextended markets. That is why this necessary transition is unlikely to be smooth.
Tighter financial conditions are good for Main Street. Lower inflation would protect household purchasing power, reward saving, and begin to narrow the gap between asset owners and everyone else. The same tightening, however, pressures the parts of the market that depend most on easy money. As investors become more selective and demand higher risk premiums, the AI capex bubble is most exposed. A slowdown in AI spending growth could be enough to deflate it. In our view, what is healthy for the broader economy may be painful for the narrow group of stocks that has led this market.
Stock Market Outlook:
We believe the stock market offers a poor risk-reward. The S&P 500 is extremely overvalued, and concentration risk has worsened significantly this year. The 20 largest stocks now make up about 49% of the index. Even after a 29% selloff, the volatile semiconductor sector still makes up 18%. That means the U.S. stock market is dependent on the AI bubble. Additionally, the broad market peaked on August 14, and most stocks have been in a correction for about ten weeks.
The S&P 500 is only 2.8% below its all-time high and is up 12.3% this year. Beneath the surface, though, the typical stock tells a different story. The median stock in the index is 14.6% below its 52-week high. A total of 171 stocks (34.2% of the index) have fallen more than 20%, putting them in bear-market territory, and 93 (18.6% of the index) have fallen more than 30%.
We believe much of this weakness reflects the sharp rise in interest rates and investors seeking higher risk premiums. Historically, weak market breadth has often come before significant market declines. Unless interest rates fall significantly, which we think is unlikely, we expect the correction to spread to the mega-cap stocks that are holding up the S&P 500, as tighter financial conditions push risk premiums higher and valuations lower. Our bigger concern is that tighter financial conditions could deflate the AI bubble, leading to a significant bear market and a recession.
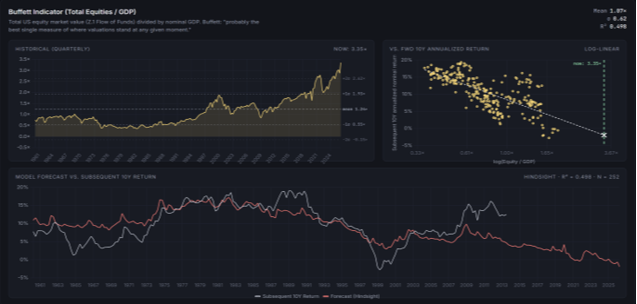
Market breadth helps us judge the stock market's short-term health, while valuation measures help us gauge its long-term risk and reward. Two robust long-term valuation models—Market Value to GDP and Shiller’s CAPE—indicate that the S&P 500 is projected to deliver annual returns between -2.0% and 2.4% over the next decade. Given that 30-year Treasury Inflation-Protected Securities (TIPS) currently yield a real return of 3.1%, equities are substantially overvalued and present an unattractive risk premium.
Market Value to GDP – "Still, it is probably the best single measure of where valuations stand at any given moment." –Warren Buffett, December 10, 2001. Based on market value relative to GDP, stocks are more than 3 standard deviations above their historical average and more expensive than they were during the 2000 technology bubble. Over the next ten years, the model forecasts an annual return of -2.0% for the S&P 500.
Source: MCM, FRED
Shiller's CAPE (a valuation measure that smooths out cyclical earnings fluctuations) indicates that stocks are 2 standard deviations above their long-term average, and the 10-year expected return is about 2.4% per annum. Since the 30-year Treasury Inflation-Protected Securities (TIPS) yield a real return of 3.0%, the S&P 500 offers an inadequate risk premium.
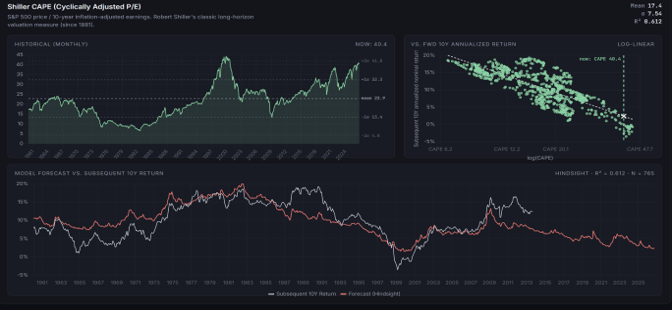
Source: MCM, FRED
In Summary
An energy shock, weak breadth and rising interest rates, coupled with extreme valuations and heavy concentration in AI stocks, make for a very high-risk environment. Rising rates and risk premiums are already weighing on most stocks. We expect the correction to continue and to spread to the mega-cap stocks that have held up the S&P 500. If the financial conditions deflate the AI bubble, the correction could become a significant bear market.
Portfolio Review:
As value investors, our asset allocation is driven by long-term valuation measures and the risk-reward opportunities present in the market. Moreover, we analyze the leading economic and market-based indicators to determine the probable path of the rate of change for economic growth and inflation. This enables us to strategically position our portfolio to perform well in all economic environments.
We believe the market is in a very high-risk environment. Inflation and energy prices are rising sharply. Interest rates are climbing, and investors are demanding higher risk premiums because of the 6% budget deficit, the AI capital spending boom, and the Fed's hiking cycle. Stocks have been in a correction since August 14. The median stock has fallen about 15%, and 60% of NYSE stocks are below their 200-day moving averages. Yet despite this hostile backdrop, the S&P 500 is only about 2.8% below its all-time high, held up by a few mega-cap AI stocks. Rising interest rates, weak breadth, and a market led by only a few stocks are typical conditions before significant market declines.
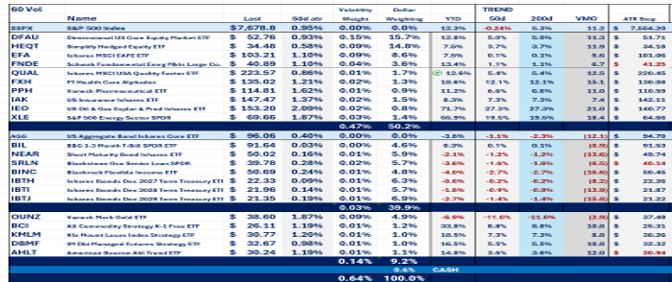
We remain underweight stocks because of weak market breadth and high valuations. We are also underweight technology stocks, since there are signs the AI bubble may have peaked. Our portfolio is diversified and invested in value and international stocks, which have typically done well when inflation is high. Recently, we sold our bank stocks, which have been struggling with rising interest rates and credit-cycle concerns. We replaced them with healthcare stocks, which are less sensitive to the economy and have strong pricing power. Given today's inflation, we hold short-duration fixed income to provide income and reduce portfolio volatility. We also hold gold and commodity trend-following funds, which tend to perform well when inflation and interest rates are rising.
After a 29.7% peak-to-trough decline in the first half of 2026, gold rebounded modestly to 3.4% in the third quarter. A stronger dollar and rising real interest rates drove gold into a bear market. Those headwinds continued in October, yet gold has held above its June low and appears to be building a base above $4,000. We believe the long-term case for gold remains intact: historically large peacetime deficits, a heavy federal debt burden, and steady central bank buying as foreign governments diversify away from the dollar. With long-term yields at their highest level in more than two decades, we believe rates are near a peak. When real yields fall, the main headwind behind this year's selloff should become a meaningful tailwind.
Beyond an overvalued market, heavy concentration in the S&P 500 and weak breadth, we are concerned that investors are largely ignoring two other risks: the spreading conflict in the Middle East, and strains in capital markets tied to the AI capex boom. Either could do real damage to an already fragile economy. Rather than trying to predict what will happen, we rely on our value-driven investment framework. Risk premiums and position sizing, not forecasts, determine how much risk we take.
We plan to maintain a highly diversified and balanced asset allocation until economic uncertainty diminishes and equities present a more favorable risk-reward opportunity
Current Risk-Weighted Portfolio: