
Five for Friday - August 9, 2024
8/9/2024
Selloff, Recession, Earnings, Points, and August
1. Selloff
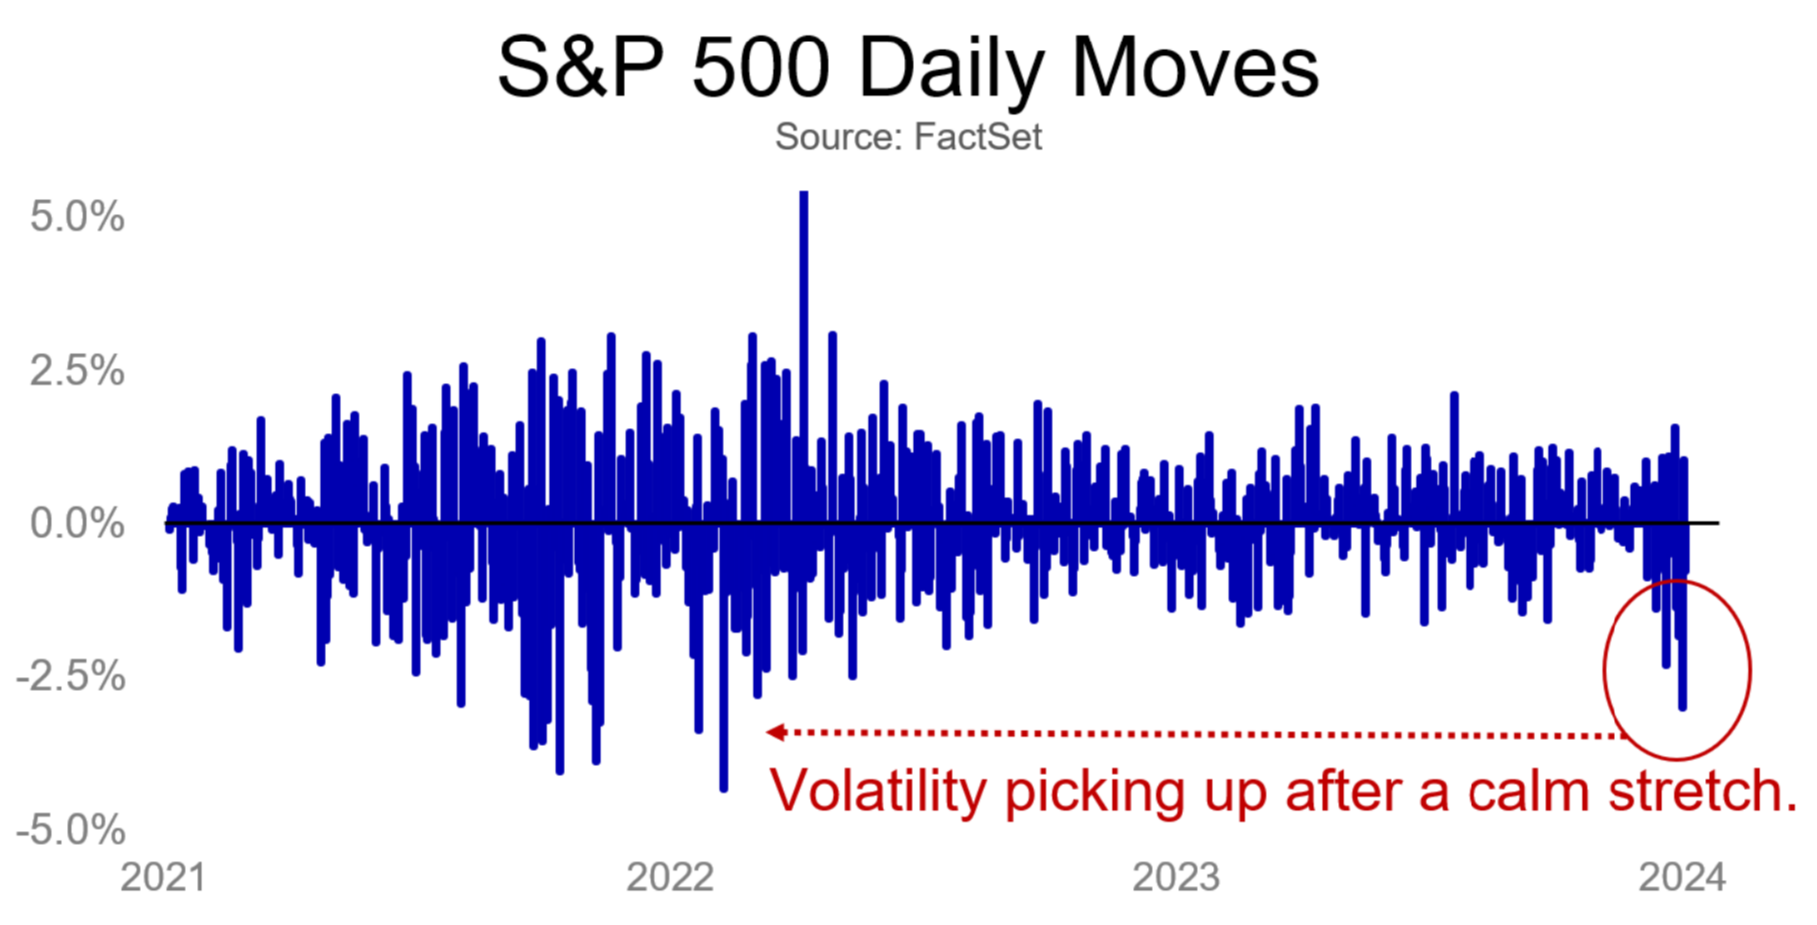
Monday was the S&P 500’s worst day since September 2022 and saw the index close -8.5% below its high. We covered the selloff in detail (here and here), but in the end, markets were sent lower by some combo of interest rates being too high, the labor market weakening, some popular trades unwinding, and a cavalcade of other items (geopolitics, A.I. worries, etc.). So, what next? On one hand, more volatility should be expected – the “positioning” unwind is unlikely yet over, and as our partners at Strategas note, there are few “market lows” found in August across history (popular comparisons like 1990, 1998, and 2011 saw big August drops only to be followed by September or October “bottoms”). Patience and proper expectations for market volatility (especially after a historically calm stretch) are warranted. On the other hand, buying market dips has been rewarded for the patient investor. Over the last 50 years, there have been 26 selloffs of 10% or greater. Measuring from the moment those selloffs hit -10%, the median forward 1-year return is 17%. Not bad at all.
2. Recession
That said, forward returns from selloffs are quite dependent on whether or not a recession occurs (selloffs associated with recessions are historically deeper and longer). The good news is – despite market volatility that might imply otherwise – odds of a deep near-term recession remain muted. The U.S. added 114,000 jobs in July, and while the unemployment rate rose, it was actually in part because more people entered the labor force (a good thing). Layoffs, meanwhile, remain low. Other items the NBER looks at to label a recession – industrial production, personal income, etc. – are also up in recent months (a clear counter to non-Covid recessions) and the Atlanta Fed forecast for Q3 GDP growth is a robust 2.9%. The U.S. is not in recession. Yet, things are also far from perfect. The labor market is cooling quickly, the Fed is behind the curve on interest rates, and risks are heightened. The market’s anxiety reflects that. But stock prices are always more volatile than the underlying economy, and a market selloff far from guarantees that a recession is imminent.
3. Profits
Another way to gauge overall economic health is to look at how the companies we invest in are actually doing. We’re currently in an earnings season (when firms report their financials to investors), and with over 75% of S&P 500 companies having reported results, things look pretty good. Per FactSet, sales growth has been +5% and Earnings +12%, beating analyst estimates to the upside by +1% and +5%, respectively. Earnings growth of 12% would be the best rate since 2021. Just as importantly, the percent of companies issuing negative guidance about future performance is below longer-run averages. Companies aren’t just doing well, but they think that can continue into the future. This should positively inform investment and hiring decisions, and squares with CEO’s remaining at least cautiously optimistic.
4. Points
One of the difficulties of being a long-term investor is the omnipresence and negativity of the news cycle. One way this manifests in downturns is when market moves are reported in “points” instead of “percentages” to amplify the seeming size of the selloff. This is pure denominator blindness (i.e., a failure to put big numbers in proper context), an affliction that pops up often in financial media. The market has gone up a lot over the last century, and it now takes far more “points” than in past to represent the same percentage change. On Monday, the Dow fell over 1,000 points (a juicy headline, to be sure). At its current level, a 1,000 point drop represents a -2.5% decline. But twenty years ago, that same 1,000 points would have meant a ~10% drop; forty years ago, it would have been an ~90% crash. Leaving that context out is misleading at best and intentionally bad faith at worst. It might seem obvious, but it’s worth remembering during the next big selloff.
5. Seasonality
It’s just something about August. Over the last three decades, some of the biggest non-recession market shocks have happened in the same mid-August stretch. In August 2015, the market experienced a massive flash crash (-4% in one day) and swoon on China growth fears. In 2011, a debt crisis in Europe and fears of a double dip recession saw the market fall over 4% on four separate August days. And in 1998, the Russia crisis and LTCM blowup sent markets spiraling (incl. a -7% panic day). Should a recession be avoided, Monday’s “yen trade and growth scare” crash can be added to the long and notorious list of mid-August weakness. Suffice to say, I’ll be saving some off-time for August 2025.
Disclosures
The information offered is provided to you for informational purposes only. Robert W. Baird & Co. Incorporated is not a legal or tax services provider and you are strongly encouraged to seek the advice of the appropriate professional advisors before taking any action. The information reflected on this page are Baird expert opinions today and are subject to change. The information provided here has not taken into consideration the investment goals or needs of any specific investor and investors should not make any investment decisions based solely on this information. Past performance is not a guarantee of future results. All investments have some level of risk, and investors have different time horizons, goals and risk tolerances, so speak to your Baird Financial Advisor before taking action.
This is not a complete analysis of every material fact regarding any company, industry or security. The opinions expressed here reflect our judgment at this date and are subject to change. Market and economic statistics, unless otherwise cited, are based on data from FactSet. The information has been obtained from sources we consider to be reliable, but we cannot guarantee the accuracy.
This report does not provide recipients with information or advice that is sufficient on which to base an investment decision. This report does not take into account the specific investment objectives, financial situation, or need of any particular client and may not be suitable for all types of investors. Recipients should not consider the contents of this report as a single factor in making an investment decision. Additional fundamental and other analyses would be required to make an investment decision about any individual security identified in this report.
For investment advice specific to your situation, or for additional information, please contact your Baird Financial Advisor and/or your tax or legal advisor.
Past performance is not indicative of future results and diversification does not ensure a profit or protect against loss. All investments carry some level of risk, including loss of principal. An investment cannot be made directly in an index.
Copyright 2024 Robert W. Baird & Co. Incorporated.
Other Disclosures
UK disclosure requirements for the purpose of distributing this research into the UK and other countries for which Robert W. Baird Limited holds an ISD passport.
This report is for distribution into the United Kingdom only to persons who fall within Article 19 or Article 49(2) of the Financial Services and Markets Act 2000 (financial promotion) order 2001 being persons who are investment professionals and may not be distributed to private clients. Issued in the United Kingdom by Robert W. Baird Limited, which has an office at Finsbury Circus House, 15 Finsbury Circus, London EC2M 7EB, and is a company authorized and regulated by the Financial Conduct Authority. For the purposes of the Financial Conduct Authority requirements, this investment research report is classified as objective.
Robert W. Baird Limited ("RWBL") is exempt from the requirement to hold an Australian financial services license. RWBL is regulated by the Financial Conduct Authority ("FCA") under UK laws and those laws may differ from Australian laws. This document has been prepared in accordance with FCA requirements and not Australian laws.


